
Does Running Protect Individuals with Knee Arthritis Against Surgery?
How can two meta-analyses with similar results have differing conclusions?

This particular meta-analysis warrants some scrutiny. Here’s why- the authors performed a systematic review (SR) and a meta-analysis (MA) to see if there was any relationship between running and osteoarthritis. Results were conflicting in the evidence likely due to the amount of variation between how studies defined running (how much, how often…etc) and osteoarthritis (pain, surgery, outcome measures…etc), as well as the time frame of study.

Statements by Timmins et al. 2016:
“Moderate- to low-quality evidence suggests no association with OA diagnosis, a positive association with OA diagnosis, and a negative association with knee OA surgery.”
"Meta-analysis suggested a protective effect of running against surgery due to OA: pooled odds ratio 0.46 (95% CI, 0.30-0.71). The I2 was 0% (95% CI, 0%-73%)"
My issue with this study is the use of the words “protective effect.” A study with very similar conclusions by Alerton-Geli et al. 2017 writes
“Recreational runners had a lower occurrence of OA compared with competitive runners and controls. These results indicated that a more sedentary lifestyle or long exposure to high-volume and/or high-intensity running are both associated with hip and/or knee OA. However, it was not possible to determine whether these associations were causative or confounded by other risk factors, such as previous injury.”
Why didn’t the authors use the word protect? The word “protect” implies preservation of the current condition against the future but the particular methods used in this MA simply do not offer any evidence that this is statistically true. First, let's explain the figure below and then I will list my reasons after.
Definitions:
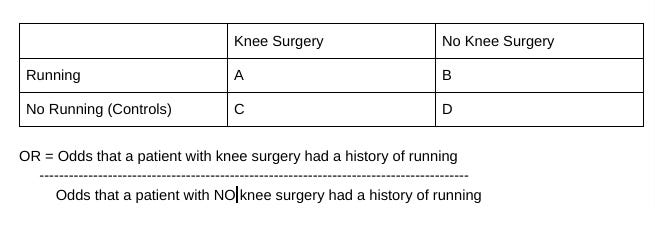
1- Odds Ratio: “Odds ratios [OR] are used to compare the relative odds of the occurrence of the outcome of interest [surgery or no surgery] given exposure to the variable of interest (running).”
Here the OR was .46 meaning the exposure (running) was associated with lower odds of surgery.
2- M-H: Mantel-Haenszel statistical method of weighing the different odds ratios in a MA from a small amount of studies- in this case, 3 studies
3- Random: A random effects model was used to account for the amount of variation between studies and sampling error. True effect is in a distribution and can vary.
4- I2 and Tau2: Statistical measures of study heterogeneity
5- Z (Test of Overall Effect): A statistical significance test for the pooled effect sizes. It is testing to see if your hypothesis of the effect size different than 0.

Study’s Interpretation: In people who have knee osteoarthritis, running may actually decrease your odds* of having surgery compared to not running. *The word odds in this usage is being conflated as a future risk.
Issues with this Meta-Analysis
1) You cannot make inferences about the future with retrospective studies
The three studies they included in their MA are case-controlled only. This means that the studies were conducted backwards in time and have confirmation and recency bias. The three studies were designed in the following manner: patients with knee OA were separated into two groups, one that had knee surgery and one that did not have surgery. Each group was then analyzed to see which patients had a history of running. Odds ratios were then calculated from the following 2 x 2 matrix.
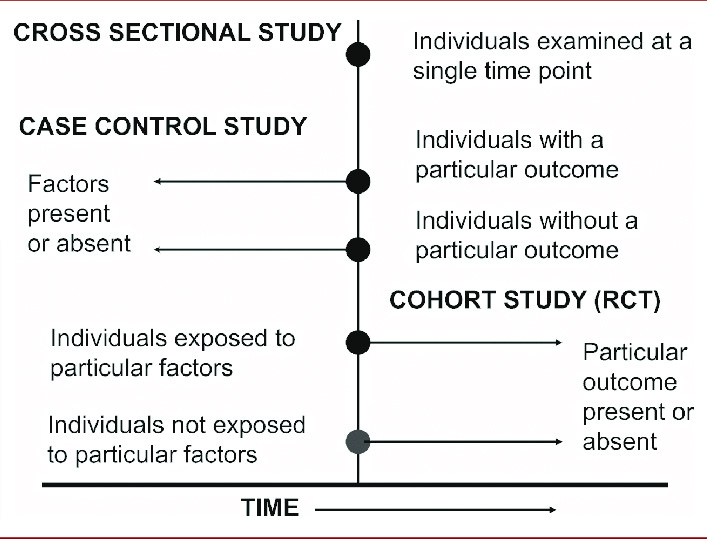
You can see in the diagram below how the arrows are pointing backward in time in a case-control study. This is in comparison to a cohort study in which time plays a crucial role in making inferences about the exposure. So I do not think it is appropriate to say running can protect the knees based on an OR of .46 supported by three case-control studies.
2) I2 0% means low between study variation yet its CI is (0-73%…)
This suggests that no variation is seen between the studies. It is strange to have 0% of any heterogeneity but the paper reports that the confidence interval (CI) is between 0 - 73%. The authors did not put this interval on this figure and I really wish they did as the size of a confidence interval in a small MA (like this one) shows how imprecise the information regarding between-study variation is. A 2015 paper goes as far to say that “we may have little confidence in any estimate [of heterogeneity] beyond the average effect size.” Now the word precision has come up a few times already, what does it mean and why is it different from accuracy.

When scientists talk about accuracy, they are talking about the degree of conformity an observation has to a hypothetical true value. In this study, the true value may be the range of odds ratios (ORs) (.30-.71) of which those who have OA and run have a lower chance of requiring surgery compared to their controls. Precision, on the other hand, is asking how reproducible the results are. As this MA only included three studies we would expect a large amount of imprecision because there could be a large amount of noise and randomness. The more studies to have in a MA more precise we can be about determining the direction of the true value. So, much of this confusion with accuracy and precision could be due to the lack of studies included in this MA. The more arrows (studies) thrown at the bullseye the better idea we have of how accurate and reliable we are. Overall low confidence can be made in this MA’s estimate of low variability between the three studies.
Final Remarks:
Recency bias can be loosely defined as expecting something to happen again because it happened before and confirmation bias is fishing for information to support a pre-existing theory. Case-control studies, unfortunately, designed with inherent confirmation and recency bias. If you are looking for factors absent or present backwards, you are prompting your study to have some factors associated with your pre-existing outcomes. This SR-MA should serve as a reminder to examine what particular studies went into the MA how studies taking a time-machine cannot, usually, predict what happens in the future.